Controlling Time Graph Visibility
Time graphs are displayed in a couple of ways.
Floating time graphs
Floating Time graphs are manually turned on and off - there is no way for MultiPing to automatically create floating graphs for you. See our Floating Time Graphs section for more details.
Time graphs docked in the main window
Time graphs that are docked in the main window have shared settings, so they scroll and resize together. These graphs can be set to automatically appear, or to only appear on command.
Normally, when you manually enter a new target name, you'll want the time graph to automatically appear. This behavior is controlled in the View menu with the "Auto-show added graphs" option. This only creates new time graphs for targets that are manually entered, not ones that are loaded from file.
Often, when loading from file, you'll have a number of targets and displaying all of them doesn't make sense. This is why the "Auto-show added graphs" doesn't apply to loading from file. If you want all graphs shown after loading a set of targets from file, use the View menu command "Show all timeline graphs" (and the counterpart command "Hide all timeline graphs").
Manually showing a graph
You can hide and/or show a time graph at any time by double-clicking on the target in the upper graph, or right-clicking the target and selecting the "Show this timeline graph" menu option.
Sorting the time graphs
The upper graph in MultiPing is easily sortable - just by clicking the appropriate column header. Time graphs, though, are not sorted that same way. If you want to sort your time graphs in a particular order, just change the sort order of the upper graph, then right-click on a time graph and select "Sort to match target list."
Resizing time graphs
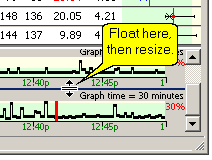
Once you get a few time graphs shown, you may wish you could resize (make them taller or shorter) the time graphs but are unable to because of the existence of the scrollbar on the time graph area.
To resize all of the time graphs, scroll to the last time graph (the scroll bar should be at the bottom of its range). Now, float your mouse cursor between the lowest graph and the one above it - you should get a resize pointer and you can then size the graphs at your pleasure. All time graph will resize to match.

