Floating Graph View Options
Floating time graphs have a number of view options that can be applied to them to match your needs. Access these options by right-clicking on a floating graph and selecting "View Options".
Note that this popup dialog can be moved by dragging it (left-click/drag). It closes when you click an area of another program outside of this dialog (i.e.: the task bar, start menu, another area of MultiPing, etc.).
- Show/Hide Title Bar. When the title bar is visible, it is a small Windows "toolbar" size of title bar. Hitting the "X" on this title bar will hide this graph. When the title bar is *not* visible, then you can move the floating graph by grabbing the upper or left-most region of the graph (shown here).
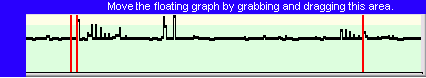
If you grab and drag elsewhere in this graph, then you'll change the time period that you're examining rather than moving the graph.
- Show Time "Tics". This is the time labels on the bottom of the graph.
- Show Address / Time Period. This is the upper edge of the graph that shows the target and current time period. We suggest that you leave this *on* - otherwise you don't know which target you're looking at, or how much time you're examining.
- Show Latency Scale. This is on the left side of the graph that shows the range of latencies that is being displayed. This is another good option to leave *on*.
- Show Packet Loss Scale. When more than one sample is displayed in every pixel, packet loss might be displayed as a percentage rather than just a red "all-or-nothing" bar. This is occasionally useful, but you may want to turn this *off* to increase the amount of data displayed in any period.
- Stay on top of everything. If this is checked, then you'll always be able to see this graph. This is a popular option to leave on.
- Transparency. You might want to be able to see what's *behind* the floating graph. Use Transparency for this. Note that this is only supported on operating systems that support alpha blending (i.e.: Windows 2000, XP, 2003).
- Set as Defaults. Once you have the options set the way you like, use this button to set the default values that will be used by all new floating graphs. You'll also be prompted here asking if you want to apply these settings to the other graph instances that are currently visible. The time period from the currently selected graph also gets set as the default time value, and is also applied across the other graphs if you select it to do so.